
Macro Outlook - July 2021
Macro Outlook - July 2021
The risk/reward is increasingly unfavorable

Although the subtitle may suggest it, this blog/Substack - whatever you want to call it - isn’t an attempt to get you to sell everything. If anything, my goal is to get a few things straight with regard to macro expectations, political developments, and to explain what this could mean for the market. Essentially, what we’re seeing is a market built on sky-high expectations as we’re apparently still dealing with a booming post-pandemic economy. Unfortunately, at least half of the prior sentence is a lie - the “booming” and “post-pandemic” parts. In this blog, I will explain why and how I’m dealing with this situation. So, let’s get to it.
The Economy Is Back…
There’s a huge difference between economic expectations and actual economic growth. On one hand, we have leading economic indicators based on expectations. On the other hand, we have (lagging) GDP growth numbers that don’t matter too much as they are useless when it comes to trading. Since the 2020 COVID stock market crash, we’ve witnessed a huge boost in economic expectations. Below are a few examples.
The first one shows business expectations as measured by the NY/Phila Federal Reserve Banks. What we’re seeing is a massive implosion in 2Q20 that completely messed up my chart as business conditions dropped more than 20 points below their 2008 lows. Unlike prior cycles, however, business conditions quickly bounced back fueled by reopened factories, looser lockdown rules, and an extremely accommodative Federal Reserve. Business conditions got another boost thanks to the vaccine news shortly after the November 2020 General Election.

Source: New York/Philadelphia Federal Reserve Banks
At this point, business conditions are at a multi-year high, even exceeding the 2018 highs.
The same is happening in Europe according to the European Sentiment Indicator. In July, the ESI made a new all-time high, suggesting that the European economy is booming. The report also showed that i.e., German manufacturing capacity utilization is close to its highest levels since measurement started in the year 2000.
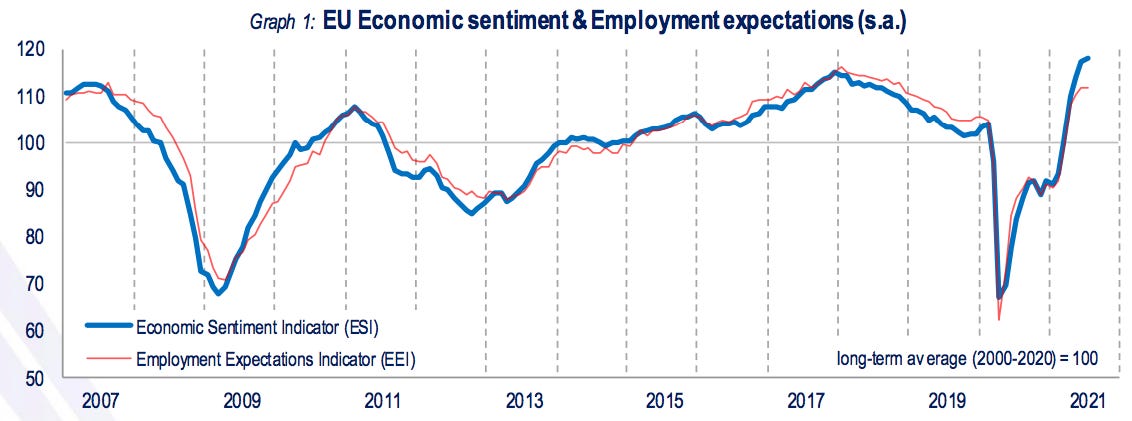
Source: European Commission Services
This is what IHS Markit had to say when it comes to Germany’s impressive rebound.
Businesses are less confident in regards to growth prospects over the coming year, which in some ways is to be expected as activity in the economy gets closer to pre-pandemic levels, but it also hints at concerns towards supply-side disruption and doubts about how quickly the remaining restrictions can be lifted. Still, in the context of series history, expectations for now remain highly positive, and this optimism continues to help drive a strong rebound in employment levels.
We’re seeing pretty much the same in the United States according to the ISM’s June report.
Customer demand remains strong. Supply chain issues continue to hamper materials availability and impact production scheduling. Supplier costs continue to rise due to increasing materials, labor and shipping costs.
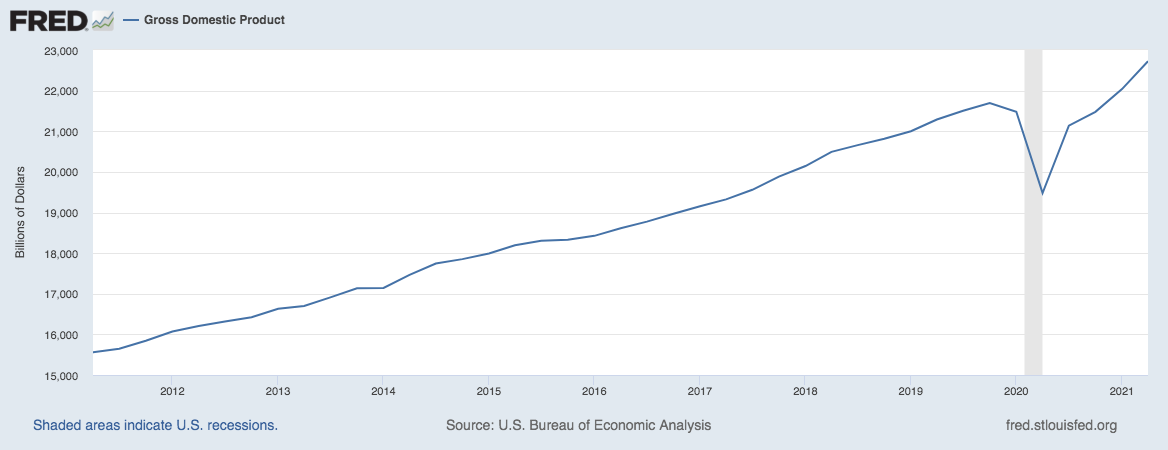
As a result of the economic reopening, massive government spending, and an accommodative Fed, we’re witnessing a massive increase in GDP in the United States.
Between 4Q19 (the official pre-pandemic benchmark) and 2Q21, GDP increased from $21.7 trillion to $22.7 trillion (Seasonally Adjusted Annual Rate). That makes the 2020 recession one of the shortest recessions ever.
… So Is The Stock Market
Based on all the aforementioned indicators and numbers, 2021 (so far) was very supportive of higher stock prices. Year-to-date, we’re seeing strength across the board:
SPY: +17.9%
QQQ: +16.8%
DIA: +14.7%
IWM: +13.5%
And, just like in 2020, Tech (QQQ) is once again beating ‘value’ (IWM) as IWM hasn’t gone anywhere since 1Q21 while tech has been in a strong uptrend after bottoming in May.
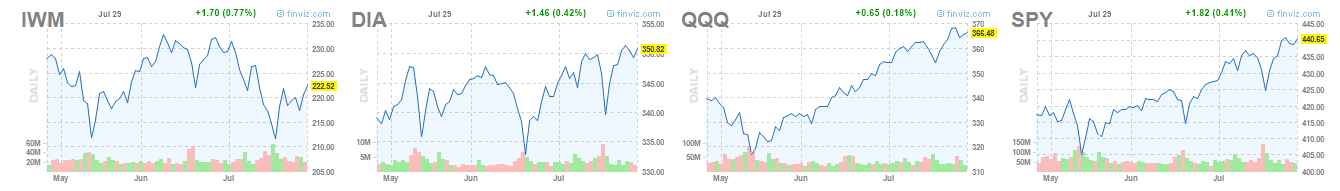
Source: FINVIZ
These developments might seem ‘weird’ but they make sense as explained by Intelligence Quarterly on July 5, 2021.
We are near my first target in the market of 4400 on the S&P futures. Over this level the likelihood of a correction grows. In all reality, the market is way overbought and comments of “bubbles” in fintwit is very high. The Fed has used market makers to pumpthe market to get to a level where a market correction of 15% doesn’t break the 4000 level(they may dip just below to scare longs out). Perception is reality, and the easiest way to achieve this is NASDAQ. Numerous times in the past two weeks, I have called for long position at 4160 and last week noted $TQQQ was best way to monetize this plan on staying a step ahead of the Fed. This will continue for at least 2 weeks and we could see 4600 by the end of July, when Congress begins to take up debt ceiling issue.
Therefore, it’s no surprise that the number of S&P 500 stocks above their 200 Day Moving Average (graph below) is glued to 90%. The Fed isn’t letting this market correct - at least until now.

Risks Are Back
This (referring to the NASDAQ pump) has happened as expected. Even when negative COVID headlines started to pop up again, the NASDAQ didn’t weaken - and, as a result, neither did the S&P 500.
While cyclical industries/sectors have recovered a bit, the overview below clearly shows what happened when uncertainty started to rise in June as prior outperformers are now underperformers. We witnessed a significant rotation that pressured cyclical stocks like energy, certain industrials, leisure, and many more while the S&P 500 continues its uptrend.

As always, there’s a wide range of (potential) risks impacting the stock market. However, this time, it’s once again uncertainties regarding the pandemic. And by that, I mean the way governments decide to deal with the pandemic.
Below are some headlines that perfectly explain the current situation.
Australian soldiers to help with virus checks as PM sets plan to freedom
China’s Biggest Covid Outbreak In Months Triggers Large New Lockdowns
India's Kerala state orders lockdown as COVID-19 infections rise
Biden Admin Not Ruling Out Further Lockdowns If Scientists Recommend Them
And, to add even more uncertainty, the CDC reversed its indoor mask policy, saying that even fully vaccinated people and kids should wear masks indoors.
In other words, when it comes to COVID, we are stuck in a situation of new variants, doubts about vaccine safety, a CDC that won’t even allow vaccinated people to return back to normal (whatever that means), and a mix of official government comments that won’t make a high vaccination rate likely.
It also doesn’t help that we continue to deal with significant supply chain issues as the ISM and IHS Markit comments already suggested. For example, container freight rates are exploding and it is extremely unlikely that rates are coming down anytime soon.

Source: Twitter
On top of that, we’re dealing with a significant labor shortage caused by high pandemic-related unemployment benefits. This, too, is unlikely to change anytime soon.


Another risk that has been clearly visible is rising inflation. Core inflation in June (that’s all items less food and energy) rose to 4.5%. That’s the highest reading since the 1990s. Needless to say, as long as this is the case, we’ll witness rising pressure on the consumer due to changing purchasing behaviors.

One way the Federal Reserve could fight inflation is by tapering QE and eventually raising rates. However, don’t bet on that happening anytime soon as there is no way that the Fed is going to taper before next year’s midterm elections. Especially not if economic growth weakens going into next year - which is likely given the circumstances.
Visualizing The Risk/Reward
The best thing about leading indicators (i.e., the first one I used in this blog) is the high correlation with the S&P 500. The graph below compared regional Fed business conditions to the year-on-year performance of the S&P 500. It’s fair to say that the risk/reward isn’t great up here. The same was the case in 2015 and 2018.

Source: Twitter
A similar pattern is visible when looking at the ratio between high yield corporate bonds (HYG) and long-term government bonds (TLT). The ratio has rolled over, hence indicating that peak growth is behind us.
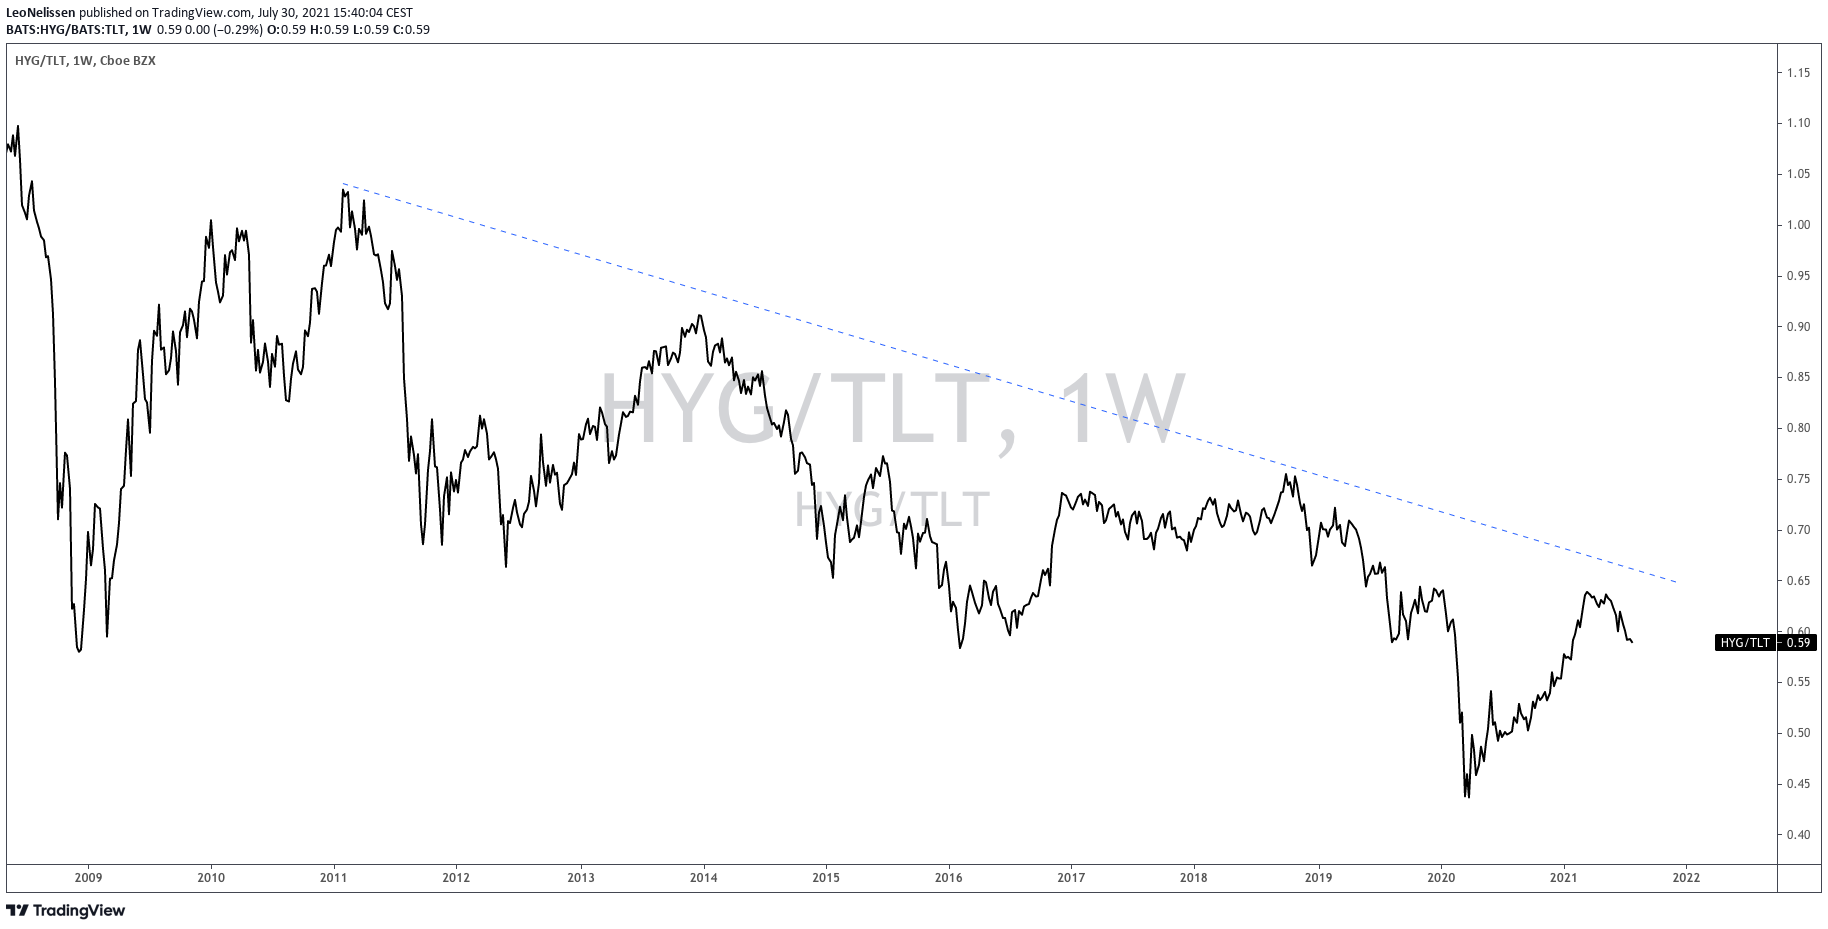
Source: TradingView
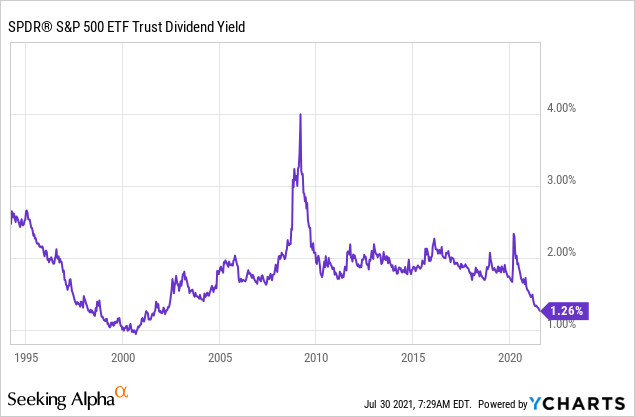
It also doesn’t help that the S&P 500 dividend yield has dropped to 1.3%. That’s the lowest yield since the early 2000s after high dividend growth kept the yield close to 2% between 2010 and 2020.
Final Thoughts
Things have clearly picked up after lockdowns last year as businesses are reporting higher sales and earnings again while desperately looking to hire new employees. Stock indices are soaring, which suggests that everything is fine.
However, the problem is that the risk/reward isn’t great for a lot of reasons. One core reason is the fact that we’re once again about to enter a flu season with stricter health guidelines and pending lockdowns. Additionally, we’re witnessing high inflation, which is starting to impact consumers. Meanwhile, the Fed won’t do anything due to political reasons in 2022.
I think that leading economic indicators have peaked (globally). This is now triggering a rotation from cyclical investments back to more defensive investments (risk-off) and could cause a 10-15% S&P 500 drawdown over the next few months.
I positioned myself by selling short-term investments to raise cash. I also increased my savings rate to be prepared to buy high-quality stocks at lower prices. I did not sell a single share of my long-term investments. At this point, I wouldn’t even mind a correction as that would allow investors (in general) to avoid buying into low-yield investments in an unfavorable risk/reward environment.